
Math Toolkit
We can use these excellent math resources throughout the year to help build our skills.
|

|

|

Grade 5/6 - Chapter 2: Number sense
Show me the ways: to model and sketch numbers, we need to understand basic place value first. We can use this tool to review what numbers in expanded form look like. Standard form in this activity will help us understand place value for 5-digit numbers.

Part of our learning goal for this unit will be to represent or show numbers in different ways, including reading number words. Practice writing out the numbers words with this number to word converter.
Once you've practiced, try this quiz! You can also try place value here!
Once you've practiced, try this quiz! You can also try place value here!
*Another way we can represent numbers is by comparing and ordering them by using what we know about
place value. Let's use this game to test our skills.
place value. Let's use this game to test our skills.
|
Renaming numbers means representing them in different ways. We need to understand place value to be able to show what we know. Click the chart for more.
|
|
Showing what we know about numbers in this unit means we're also working with decimals. The image on the left will help us use place value to read, write, and compare decimal values. |

|

|
Look at the number to the left. if you can read it, spell it, and represent it in a decimal place value chart, then you are on your way to successfully completing this unit! Get some more practice here. |
Grade 5/6 - CHapter 1: Patterning
Well done reviewing patterning boys and girls. Like we talked about, a pattern is something that happens over and over, or repeatedly. Patterns can increase or decrease too. They have different attributes, like size, shape, or orientation. Do you remember what the part that repeats is called? Think of the inside of an apple, or just ask the grade 5s!
Understanding different number patterns can help us with other ideas in math like adding or dividing. Click the number pattern above to review.
Grade 5/6 - Algebra: expressions, equations and variables
We can start by using this explanation to find out what these terms mean. Watching this Homework Zone video will help us get a better look at equations. Start with this game to see if you can balance the expressions. If you think you're ready for equations, try this game.

Click the picture above to learn more about basic algebra. This site will help with more practice to meet our learning goals for the unit.
Grade 5/6 Data Management

Like we talked about, our learning goals will help us stay focused on what we need to do to succeed in this unit. Be sure to review them in your duo tang or below.
We are learning to:
- Create survey questions with different options and collect the data;
- Show information in different graphs (i.e. bar graph or broken line graph);
- Explain what we learned from the data in different graphs (i.e. trends).
We are learning to:
- Create survey questions with different options and collect the data;
- Show information in different graphs (i.e. bar graph or broken line graph);
- Explain what we learned from the data in different graphs (i.e. trends).
This important tool will help us get some practice with sharing information in graphs, and you can also click the image above to build your skills. We will be using IXL Math to practice different skills. If you have completed your classwork, click each section below to practice your skills:
Creating Line Graphs - Interpreting Line Graphs
The video below will help us get started with our next lesson: Bar Graphs with Intervals.
Creating Line Graphs - Interpreting Line Graphs
The video below will help us get started with our next lesson: Bar Graphs with Intervals.
This note will help us review. Now that we've had some more practice, we can use this tool to make our own graphs. Try these activities as well:
Creating Histograms - Interpreting Histograms
Creating Histograms - Interpreting Histograms
Today we learned that a pictograph is a graph that represents values with pictures. The picture we choose in our graph should represent the main idea of the data.
Practice your pictograph skills below:
Create pictographs - Interpret pictographs
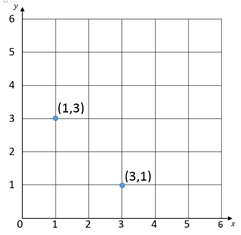
Grade 6 Data Management
|
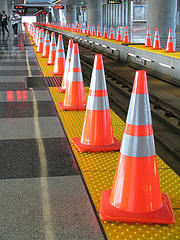
If you've ever had to find your seat in a stadium, then you have used a grid formation to watch the big game! Click the image of the stadium to get a closer look.
This link will help us understand some of the vocabulary and ideas we need to know to meet our learning goals for the unit. Get some practice working with coordinate pairs for our first lesson here. |
|
Building comfort plotting coordinate pairs will help us make and describe trends in line graphs. It will also prepare us to create and interpret scatter plots. Interpreting this type of graph means we can explain relationships between values being compared on them. Click the image to the right to learn more. Practice describing scatter plot trends here. |

|

|
Great detective work today, you did very well to explore what mean and median are. If you need to review again, listen to the song here, or read this chart. Let's see if you and your group can use what you learned to complete this task. Once you are finished, you can try creating your own set of numbers to investigate mean and median with this applet. |
Grade 5/6 Math - Addition & Subtraction strategies
How do you add and subtract? There's more than one way? Of course there is! We'll begin this chapter by taking a look at how to estimate sums and differences. This number line tool will help us visualize rounding and estimation as we solve different math problems. If you need more time to review, watch the YouTube video below.
Understanding how to round numbers will help us build our number sense too, let's review with the videos below.
|
|
|
|
Learning Goal(s): we are learning to solve addition and subtraction problems by using different strategies.
Grade 5/6 math - Measurement

Excellent discussion today, we talked about how we use measurement to describe objects, and how we can use our own experiences with measurement to solve math problems. The images below will help remind us to use estimation to justify the unit we would choose to measure different lengths.

|

|

|

|

|
Be sure to remember the measurement language to match the images to help visualize the different units (i.e. thickness, width, height, and length). Now that we've had a chance to work together to choose appropriate measurement units, get more practice here.
To justify your choice, don't forget our success criteria:
- identify your choice (unit);
- explain what you know about the unit you chose (*about);
- explain what you know about the question;
- write a closing sentence.
To justify your choice, don't forget our success criteria:
- identify your choice (unit);
- explain what you know about the unit you chose (*about);
- explain what you know about the question;
- write a closing sentence.

Now that we can choose and justify an appropriate unit to measure different lengths, we are going to focus on our learning goal of relating units of length to each other. How can the ladder on the left help? Let's find out...
After we brainstorm together, we can compare our ideas and get some practice with this activity. This converter will help you check your work in progress.
After we brainstorm together, we can compare our ideas and get some practice with this activity. This converter will help you check your work in progress.
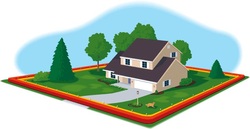
If you are a master of metric conversion, you should be able to build a shed here! Practice with this metric length game, or use this ruler activity to see if you're getting it!
How does this picture help us connect to perimeter? Like you explained, perimeter helps us with measurement in everyday life. If you need to review, try this activity, or you can practice calculating perimeter here. This video can also help.
|
Let's look at another form of measurement: elapsed time. Check your time skills first by practicing here. How much time do we spend at school everyday? How can you calculate it? Click the picture of the clock to look at calculating elapsed time. Now that you've watched it, can you answer the first question?
We can use this interactive link or this game to practice. Update: here is a video to help us use subtraction. |

|
Grade 5/6 Math - Multiplication & Division

As we learned, there are some clear connections between addition and multiplication. If you need a quick reminder, look in your duo tang or check out this definition. You also showed how we can use simple multiplication facts like
1 x 9 = 9 to solve more difficult facts like 10 x 90 = 900, or 100 x 900 which is...
Once you master multiplication with tens and hundreds, you can begin to use estimation to see if more difficult multiplication facts are reasonable. You can also use these skills to actually answer harder questions too! The open arrays game will help you practice the skills you are building. Practice rounding and estimating products here! If you need to review your times tables, use the chart below.

Use this game from mathisfun.com to practice 12 x 12 facts or multiplying tens!
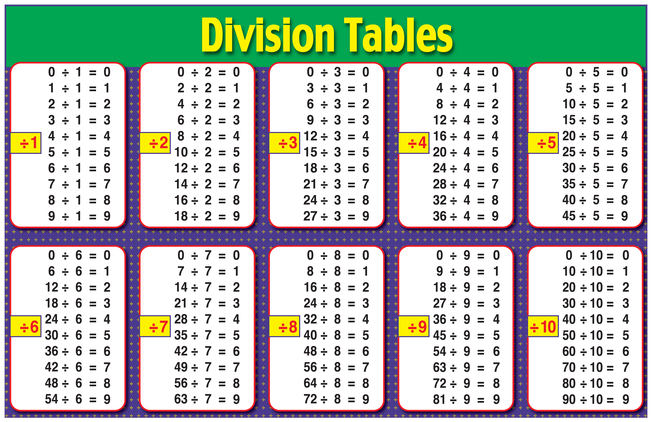
The great divide: see if you can use this note to figure out the connection between multiplication and division. Try looking for connections or patterns in the division table below with the chart above to help!
Grade 5/6 Math - 2d Geometry

What does this airplane have to do with 2D geometry? Hint: it has more to with the word plane! Take a look at this definition to see if you can make the connection. If you need more information, this link will help.
Check: Is a triangle a plane? How do you know?
Check: Is a triangle a plane? How do you know?
Now that you are a master of planes and triangles, can you make a triangular plane? Let's use the links below to get started. Once you're done viewing, ask yourself: what are the steps I need to know?

|
|
|
|

Understanding the different types of angles will help us construct angles correctly, and also with classifying triangles as we go along.
Try these activities to see if you are an angle master:
Game - Practice estimating and measuring.
Quiz - You need a protractor to complete this quiz!
Click the picture to the left to try classifying angles.
|
Now that we've worked on classifying triangles by angle and side length, click the toaster to take the quiz.
|

|

|

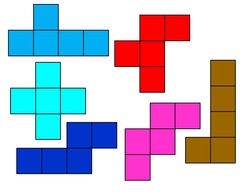
The chart to the left and the activity that follows will help us construct different polygons when we have math information like side length and angle to work with.
Click here, or the chart to take a look at the properties of polygons.
Sorting Polygons by properties
Part of our learning goals for this unit involved classifying polygons according to their features. Now that we have a better understanding of polygon properties like what a regular shape means, we can begin to sort different shapes based on their differences and similarities. If you need to review properties of symmetry, click the picture to the left.
Let's try this sorting activity to check our understanding.
Grade 5/6 Math - Area
Do you remember how to calculate the perimeter of the shapes to the left? How about the area? If you need to refresh your memory, get started here!
Click here to take a look at how length and width affect the area of a rectangle. This link will help you create different area measurements. You can try this quiz too.
|
Use the image to the right to practice the area of a rectangle. Can you complete the question using mental math? Can you justify your answer?
|

|
If you take a look at the picture of the shape to the left, you can begin to explore the area of a parallelogram. If the area is 72 cm squared, what could the formula be? Click the shape to learn more. Watch the YouTube video to see how the word base is part of our math language for this unit.
Try this quiz to check your understanding.

Now that we have had practice with the area of parallelograms, this activity will help us get started with the next learning goal: figuring out and using the formula for area of a triangle. Click the image to get started.
Let's use this reference to practice or review. Here is another link.
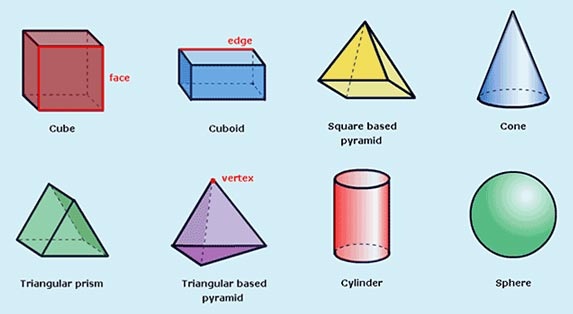
Grade 5/6 math - 3d geometry & Measurement
Now that you're a polygon professional, it's time to move to another dimension...literally! What makes a 3D shape? Do you see any 3D shapes in this picture? This activity will help us check our understanding. Let's work in groups to complete this next quiz.
We will be using this lesson as an important resource throughout the unit.
You can also review how nets show the relationship between 2D and 3D shapes, this will help us draw solids, but also how to figure out their surface area.
We will be using this lesson as an important resource throughout the unit.
You can also review how nets show the relationship between 2D and 3D shapes, this will help us draw solids, but also how to figure out their surface area.

We can use what we know about 2D shapes to help learn about 3D shapes. One example of this is using the area of a flat shape to understand the volume of a solid shape. After we complete the volume sheet together, let's check our understanding with this video.
|
|

Grade 6s, if you remember the formula for the area of a triangle, you're close to figuring out the volume of a triangular prism. Use the video to get more help.
|
|
Get some practice with the volume of cubes and rectangular prisms here, or show what you know about the volume of triangular prisms here.
Grade 5/6 Math - Probability

Let's get started by working on the following questions: What is probability? How can we show it in math? Click the image above to get started. Once you're ready, try using this activity to see if you can explain examples of probability in the game.

|
|
As you can see in the probability line above, we can describe probability with math words, but also fractions. Take a look here to get some practice. Once we understand how to express probability as a fraction, we can look as showing probability as a percentage as well. If you're ready, use this quiz to see if you can show probability in all three ways! See if you can express probabilities in different ways as a population biologist!
